BMI Calculator
Last updated: 27 June 2026
Reviewed by Gavin Meiring, Lead research and primary author · Doctoral Candidate (Corporate Governance) · Research and drafting assisted by AI
- The BMI formula was invented by Belgian mathematician Adolphe Quetelet in the 1830s. It was never designed to measure individual health — it was a population statistics tool.
- BMI doesn't distinguish between muscle and fat. Elite athletes like rugby players often register as 'obese'. The WHO now recommends using BMI alongside waist circumference.
- The BMI thresholds (underweight <18.5, normal 18.5–25, overweight 25–30, obese 30+) were largely set by a US government panel in 1998 — instantly making 29 million Americans 'overweight' overnight.
BMI Calculator
A BMI calculator works out your Body Mass Index, a simple numerical measure that relates your weight to your height. It is used by healthcare professionals, individuals monitoring their health, and public health researchers as a quick screening tool for potential weight-related health risks. While BMI has limitations, it remains the most widely used population-level indicator of healthy weight range.
How to Use the BMI Calculator
- Enter your weight in kilograms (or pounds if using imperial units).
- Enter your height in metres and centimetres (or feet and inches).
- The calculator divides your weight by your height squared and displays your BMI.
- Your result is placed within one of the standard WHO categories: underweight, healthy weight, overweight, or obese.
- Review the notes about age, sex, ethnicity, and muscle mass that affect interpretation.
The Formula
BMI = Weight (kg) divided by Height (m) squared
Or in imperial units:
BMI = (Weight in pounds multiplied by 703) divided by Height in inches squared
Where:
Weight is measured in kilograms (metric) or pounds (imperial). Height is measured in metres (metric) or inches (imperial). 703 is the conversion factor to adjust for imperial units.
Real-World Example
A person weighs 80 kg and is 1.75 metres tall.
BMI = 80 divided by (1.75 multiplied by 1.75) = 80 divided by 3.0625 = 26.1
A BMI of 26.1 falls in the "overweight" category according to standard WHO classifications:
Below 18.5: Underweight 18.5 to 24.9: Healthy weight 25.0 to 29.9: Overweight 30.0 and above: Obese (Class I at 30 to 34.9, Class II at 35 to 39.9, Class III at 40 and above)
For UK and South Asian populations, Public Health England uses a lower threshold: BMI of 23 to 27.4 is considered overweight, and 27.5 and above is considered obese. This reflects evidence that South Asian adults face higher health risks at lower BMI values than white European adults.
Understanding BMI's Limitations
BMI is a useful population-level screening tool, but it has important limitations for individual assessment.
BMI does not distinguish between fat mass and muscle mass. A heavily muscled athlete may have a BMI in the "overweight" range despite having very low body fat. Conversely, an older adult may have a "healthy" BMI while carrying an unhealthy proportion of fat and very little muscle (sometimes called "skinny fat" or normal-weight obesity).
BMI does not account for where fat is distributed on the body. Abdominal fat (visceral fat around the organs) is significantly more harmful to health than fat stored on the hips and thighs. Waist circumference is considered a more direct measure of harmful fat distribution. For adults, a waist circumference above 94 cm for men or 80 cm for women indicates increased metabolic risk.
Age and sex also affect interpretation. Older adults naturally have more fat mass at any given BMI, and women typically have higher body fat percentages than men at the same BMI. Children and teenagers should use age- and sex-specific BMI-for-age percentile charts rather than adult BMI thresholds.
Reference Table: BMI categories and worked values
The World Health Organization adult cut-offs are shown first, then five worked calculations so you can check the arithmetic by hand. BMI is weight in kilograms divided by height in metres squared. The categories apply to adults; they are not used for children or during pregnancy.
| Category | BMI range |
|---|---|
| Underweight | Below 18.5 |
| Normal range | 18.5 to 24.9 |
| Overweight | 25.0 to 29.9 |
| Obesity class I | 30.0 to 34.9 |
| Obesity class II | 35.0 to 39.9 |
| Obesity class III | 40.0 and above |
| Height | Weight | BMI |
|---|---|---|
| 1.60 m | 50 kg | 19.5 |
| 1.70 m | 65 kg | 22.5 |
| 1.70 m | 80 kg | 27.7 |
| 1.80 m | 95 kg | 29.3 |
| 1.75 m | 70 kg | 22.9 |
Worked Example on Screen
The capture below shows BMI Calculator after the inputs were entered, with the result on screen. Enter the same values to reproduce it.
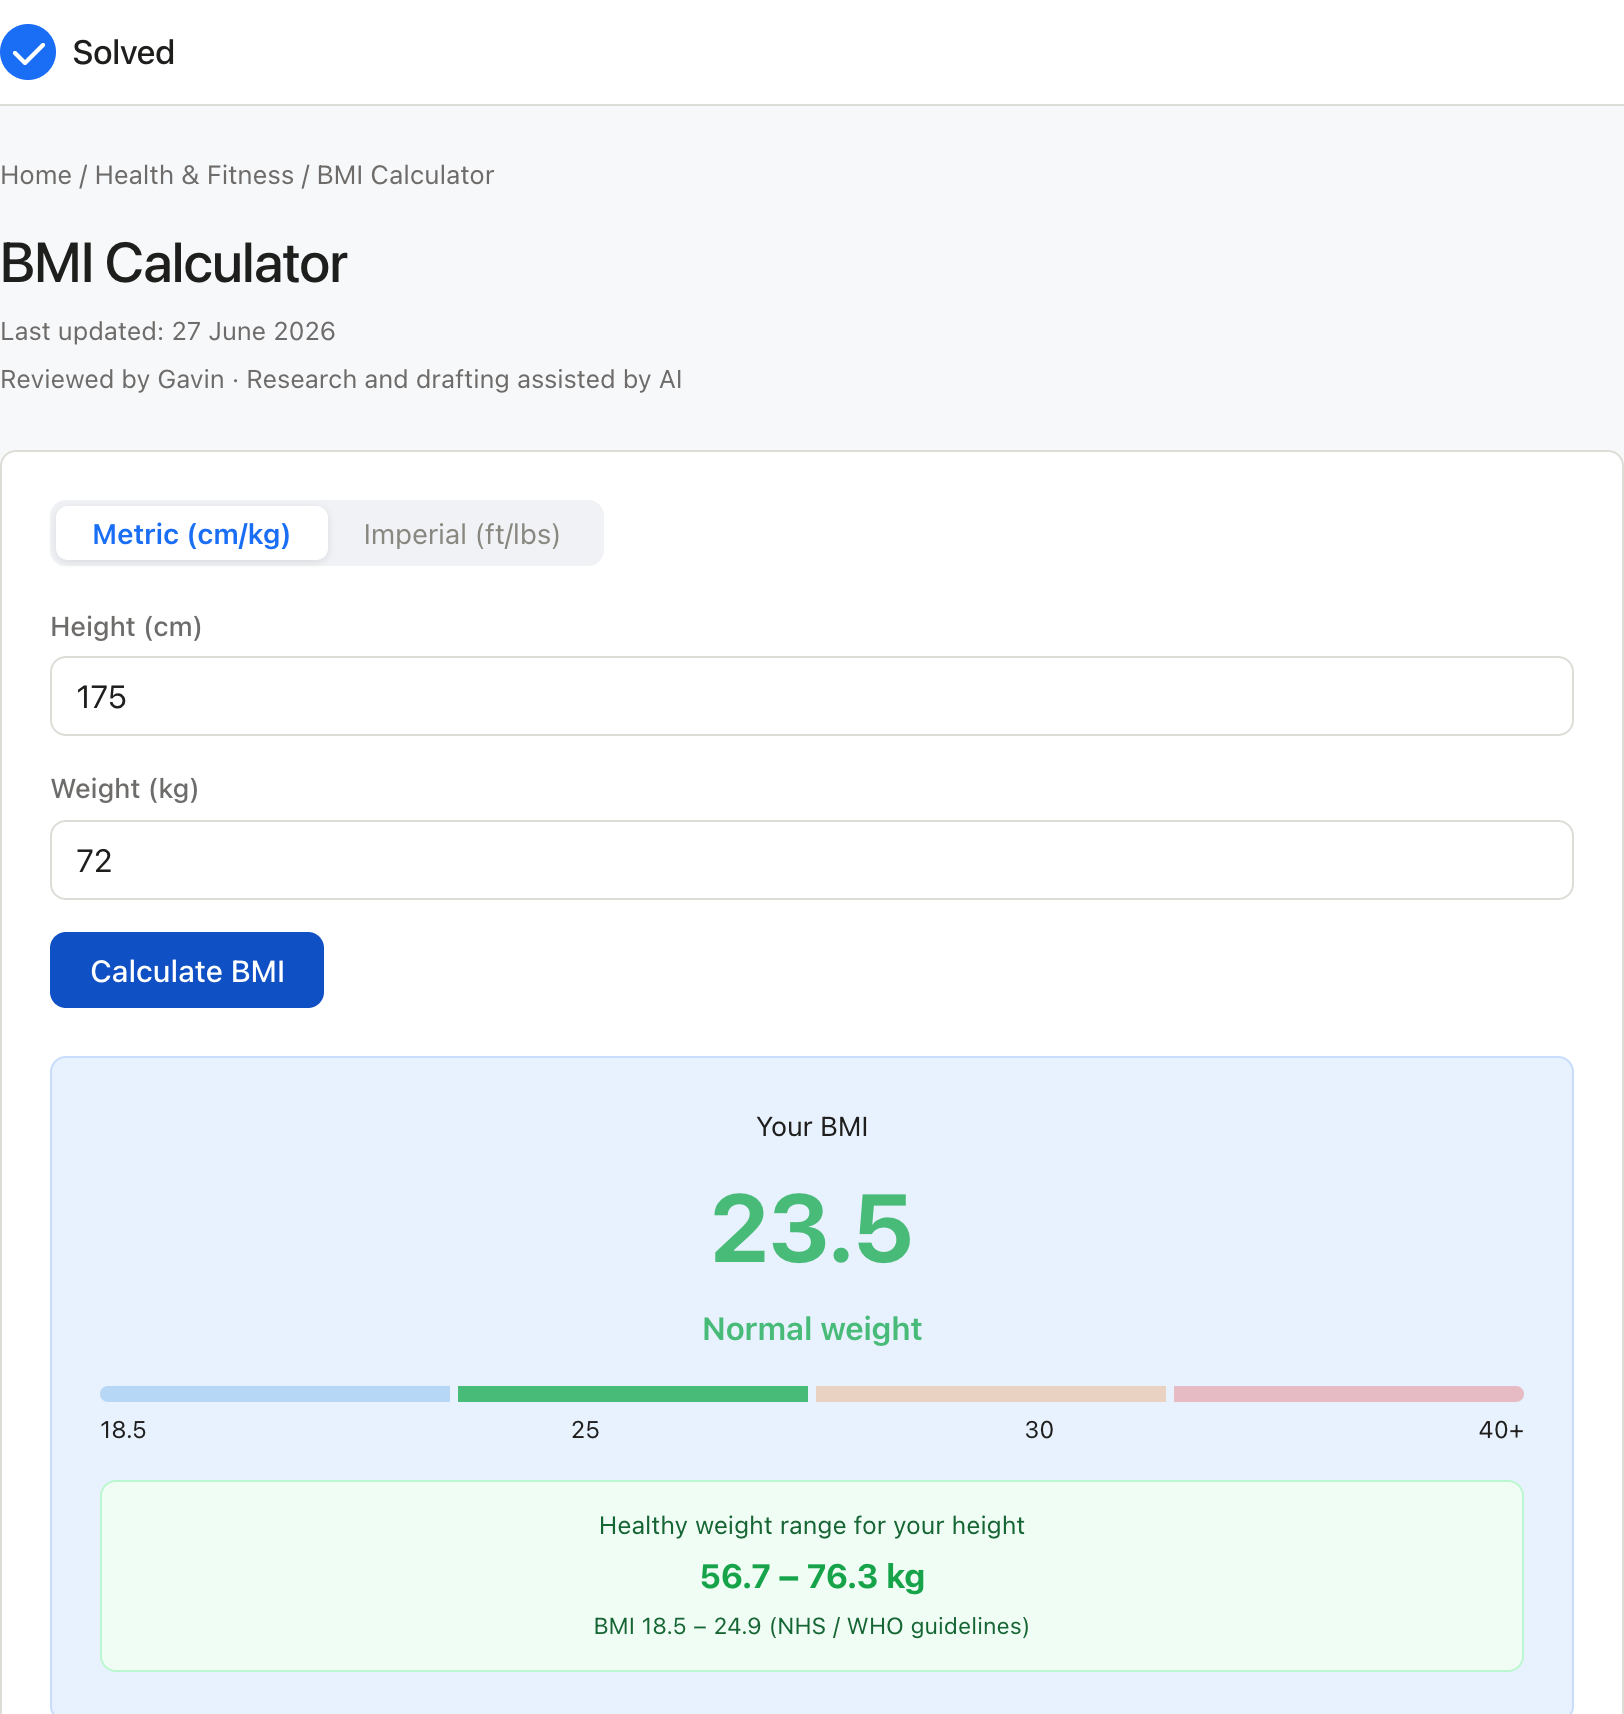
Captured from solved.tools on 10 September 2026.
How we tested this calculator
We re-ran this calculator on 14 September 2026 and recorded every input and every result. Fifteen runs went through the tool: eleven on the metric tab and four on the imperial tab. Each result was compared with the same sum worked on paper. All fifteen agreed.
The arithmetic is the one part of a BMI page that can be checked exactly, so that is what we check. Interpretation is a separate question and the limitations sections below cover it.
The method, and the source of every constant
The tool divides weight by height squared, converting height to metres first. Five constants decide the result and its category.
| Constant | Value | What it decides | Source |
|---|---|---|---|
| Underweight boundary | 18.5 kg/m2 | Lower edge of the healthy band | World Health Organization adult classification, WHO expert consultation, The Lancet, 2004 |
| Healthy upper boundary | 24.9 kg/m2 | Upper edge of the healthy band, and the healthy weight range line | Same WHO classification |
| Overweight boundary | 25.0 kg/m2 | Start of the overweight band | WHO obesity and overweight fact sheet |
| Obesity boundary | 30.0 kg/m2 | Start of the obesity band | Same WHO fact sheet |
| Imperial factor | 703 | Converts lb/in2 into kg/m2 | NIST SP 811 |
The 703 factor is not a measured quantity. One pound is 0.453 592 37 kg and one inch is 0.0254 m, both exact under the SI definitions NIST publishes, so the exact multiplier on lb/in2 is 703.0696. The tool uses the rounded 703, which moves a result by less than 0.01 BMI. The UK clinical wording for the same bands sits in NICE CG189.
Worked examples we ran
Every row was entered into the live tool on 14 September 2026. The hand figure is the same sum worked on paper.
| Height | Weight | Tool showed | Category shown | Hand figure | Agrees |
|---|---|---|---|---|---|
| 175 cm | 80 kg | 26.1 | Overweight | 80 / 3.0625 = 26.12 | Yes |
| 175 cm | 70 kg | 22.9 | Normal weight | 70 / 3.0625 = 22.86 | Yes |
| 170 cm | 65 kg | 22.5 | Normal weight | 65 / 2.89 = 22.49 | Yes |
| 175 cm | 76.5625 kg | 25.0 | Overweight | 76.5625 / 3.0625 = 25.0000 | Yes |
| 175 cm | 76.56249 kg | 25.0 | Normal weight | 76.56249 / 3.0625 = 25.0000 to four places | Yes |
| 175 cm | 91.875 kg | 30.0 | Obese | 91.875 / 3.0625 = 30.0000 | Yes |
| 175 cm | 91.8749 kg | 30.0 | Overweight | 91.8749 / 3.0625 = 30.0000 to four places | Yes |
| 175 cm | 56.65625 kg | 18.5 | Normal weight | 56.65625 / 3.0625 = 18.5000 | Yes |
| 175 cm | 56.6562 kg | 18.5 | Underweight | 56.6562 / 3.0625 = 18.49998 | Yes |
| 50 cm | 80 kg | 320.0 | Obese | 80 / 0.25 = 320.0 | Yes |
| 300 cm | 500 kg | 55.6 | Obese | 500 / 9 = 55.56 | Yes |
| 5 ft 9 in | 154 lb | 22.7 | Normal weight | 703 x 154 / 4761 = 22.74 | Yes |
| 5 ft 9 in | 176 lb | 26.0 | Overweight | 703 x 176 / 4761 = 25.99 | Yes |
| 5 ft 9 in | 196 lb | 28.9 | Overweight | 703 x 196 / 4761 = 28.94 | Yes |
| 6 ft 0 in | 200 lb | 27.1 | Overweight | 703 x 200 / 5184 = 27.12 | Yes |
Where the standard formula breaks
Four findings came out of those runs.
The same displayed number can carry two categories. The tool shows BMI to one decimal place and picks the category from the unrounded value. Weigh 76.5625 kg at 1.75 m and the page reads 25.0, Overweight. Weigh 76.56249 kg, a difference the input cannot usefully express, and the page reads 25.0, Normal weight. The same split appears at 30.0 and at 18.5. Near a boundary, read the healthy weight range line, which names the weights in your own units, rather than the rounded figure.
The healthy range stops at a different place from the cut-off table. The range line takes 24.9 as the top of the healthy band. At 1.75 m it reads 56.7 to 76.3 kg. The table higher up this page gives 76.56 kg as the weight at BMI 25. Both figures follow from the published boundaries, and the 0.31 kg between them is the gap between 24.9 and 25.0. A person weighing 76.4 kg sits above the top of the range this page prints and still below the WHO overweight boundary.
The inputs accept any number. Enter 50 cm and the tool answers 320.0, then prints a healthy weight range of 4.6 to 6.2 kg. The CDC adult calculator rejects heights outside 91.44 to 274.32 cm and weights outside 24.947 to 453.592 kg. Check that you typed centimetres and not metres. The missing input check is logged as a tool change for the engineering lane, and the page cannot fix it.
The result panel and the page text use different words for one band. The panel says Normal weight and the text says healthy weight. Both mean the band from 18.5 to 24.9.
What this page adds
The top result for "bmi calculator" on Bing, checked 14 September 2026, was calculator.net. That page carries the formula, the WHO table, the limitations, and two extra indices (BMI Prime and the Ponderal Index). It does not list any runs, does not derive the 703 factor, and does not mention what happens at a boundary.
This page now carries all three. Every constant above links to the body that publishes it, the 703 factor is derived from the SI definitions rather than asserted, and the fifteen runs are listed so a reader can repeat them in about two minutes.
We have tested the calculator, not BMI as a health measure, and this page makes no clinical claim. It reports what the tool does with numbers.
Frequently Asked Questions
Is BMI accurate for all ethnic groups? BMI thresholds were primarily derived from studies of white European populations. Evidence shows that people of South Asian, East Asian, Black African, and other non-white backgrounds face increased health risks at lower BMI values. The UK and World Health Organisation use adjusted thresholds for Asian populations (overweight from BMI 23, obese from BMI 27.5) to account for this difference.
How is BMI different from body fat percentage? BMI is an indirect estimate of body composition based purely on weight and height. Body fat percentage directly measures the proportion of your total weight that is fat tissue, using methods such as DEXA scanning, bioelectrical impedance, or skinfold callipers. Body fat percentage is a more accurate health indicator but is harder to measure than BMI, which only requires a scale and a measuring tape.
Can children use the same BMI calculator as adults? No. Adult BMI thresholds (underweight below 18.5, obese above 30) do not apply to children and teenagers because healthy body fat levels change with age and differ between boys and girls. For children aged 2 to 18, BMI-for-age percentile charts are used, with the 85th to 95th percentile indicating overweight and above the 95th percentile indicating obesity.
What should I do if my BMI is in the overweight or obese range? A BMI outside the healthy range is a prompt for further health assessment, not a diagnosis. Speak with your GP or a healthcare professional who can assess your health in the context of your full medical history, lifestyle, and other risk factors. Sustainable dietary changes and increased physical activity are the first-line recommendations for weight management, supported by evidence-based programmes available through the NHS.
The same person in imperial units
The worked example above uses metric inputs. The imperial path uses the same formula with the 703 factor, which exists because the calculation needs kilograms and metres and the inputs arrive as pounds and inches.
80 kg is 176.37 lb, and 1.75 m is 68.90 in. Feeding those into the imperial form gives 176.37 multiplied by 703, divided by 68.90 squared, which is 26.1. The two paths agree, so you can work in whichever set of units you have to hand.
A rounder pair of inputs makes the arithmetic easier to check on paper:
| Height | Weight | BMI |
|---|---|---|
| 5 ft 9 in (69 in) | 154 lb | 22.7 |
| 5 ft 9 in (69 in) | 176 lb | 26.0 |
| 5 ft 9 in (69 in) | 196 lb | 28.9 |
At a fixed height of 69 inches, 22 pounds separate the healthy-weight band from the overweight band.
What you would have to weigh at each height
The same BMI value means a different weight at every height, because height enters the formula squared. These are the boundary weights for the two cut-offs that matter most.
| Height | Weight at BMI 25 | Weight at BMI 30 |
|---|---|---|
| 1.55 m | 60.06 kg (132.4 lb) | 72.08 kg (158.9 lb) |
| 1.60 m | 64.00 kg (141.1 lb) | 76.80 kg (169.3 lb) |
| 1.65 m | 68.06 kg (150.1 lb) | 81.67 kg (180.1 lb) |
| 1.70 m | 72.25 kg (159.3 lb) | 86.70 kg (191.1 lb) |
| 1.75 m | 76.56 kg (168.8 lb) | 91.88 kg (202.5 lb) |
| 1.80 m | 81.00 kg (178.6 lb) | 97.20 kg (214.3 lb) |
| 1.85 m | 85.56 kg (188.6 lb) | 102.68 kg (226.4 lb) |
| 1.90 m | 90.25 kg (199.0 lb) | 108.30 kg (238.8 lb) |
Read the other way round, a fixed weight produces a different category at every height. A person weighing 80 kg sits above the healthy-weight ceiling at 1.75 m by 3.44 kg, and inside it at 1.85 m.
| Height | BMI at 80 kg | Category |
|---|---|---|
| 1.70 m | 27.7 | Overweight |
| 1.75 m | 26.1 | Overweight |
| 1.80 m | 24.7 | Healthy weight |
| 1.85 m | 23.4 | Healthy weight |
| 1.90 m | 22.2 | Healthy weight |
Twenty centimetres of height carries the same weight across the cut-off. That is the formula working, not a judgement about the two people.
How the formula behaves in practice
Height is squared, so a mistake in height moves the answer more than the same mistake in weight. At 1.75 m, entering 1.73 m instead lifts the result from 26.1 to 26.7. Entering 1.77 m drops it to 25.5. Measure height without shoes and at roughly the same time of day, because the spine compresses over the course of one.
The measure uses weight and height only. It carries no information about body composition, fat distribution, frame size or fitness, and it does not adjust for sex. It applies to adults. It does not apply to children, to pregnancy, or to highly trained athletes, whose muscle mass pushes the number up while fat mass stays low.
Where the adjusted thresholds come from
The 23 and 27.5 figures used for South Asian populations come from a WHO expert consultation published in The Lancet in 2004, volume 363, pages 157 to 163. That consultation kept 25 and 30 as the international classification for overweight and obesity and set 23.0, 27.5, 32.5 and 37.5 kg/m2 as public health action points along the BMI continuum, on the evidence that the risk of type 2 diabetes and cardiovascular disease rises at lower BMI values in Asian populations.
NICE public health guideline PH46, published in July 2013, adopted 23 kg/m2 to indicate increased risk and 27.5 kg/m2 to indicate high risk for adults from black, Asian and other minority ethnic groups. PH46 has since been replaced by NICE guideline CG189. A reader comparing this page with UK clinical guidance should check CG189 for the current wording.
Also try these free tools: