Standard Deviation Calculator
Last updated: 27 June 2026
Reviewed by Gavin Meiring, Lead research and primary author · Doctoral Candidate (Corporate Governance) · Research and drafting assisted by AI
- Standard deviation was popularised by Karl Pearson in 1893. He borrowed the concept from Francis Galton, who used it to study heredity and height distributions.
- In a normal distribution, 68% of values fall within 1 standard deviation of the mean, 95% within 2, and 99.7% within 3 — known as the '68-95-99.7 rule'.
- Financial analysts use standard deviation to measure investment risk. A high standard deviation in returns means the investment is more volatile — not necessarily more dangerous.
Standard Deviation Calculator
A standard deviation calculator measures how spread out a set of numbers is around their mean. It is used by students, researchers, data analysts, and quality control engineers to understand variability in any dataset.
How to Use the Standard Deviation Calculator
- Enter your data values separated by commas or one per line in the input field.
- Select whether your data represents a full population or a sample (choose sample if in doubt for most real-world datasets).
- Click Calculate to see the mean, variance, and standard deviation.
- Review the results table which shows each value's deviation from the mean.
- Use the population option only when you have data for every member of a defined group.
The Formula
For a sample standard deviation (s): compute the mean of the data values, subtract the mean from each value to find each deviation, square each deviation, sum all squared deviations, divide by (n minus 1) where n is the number of values, then take the square root. For population standard deviation (sigma), divide by n instead of (n minus 1). The (n minus 1) correction, called Bessel's correction, reduces bias when estimating a population's variability from a sample.
Real-World Example
Dataset: exam scores of 5 students: 72, 85, 90, 68, 79. Mean = (72 plus 85 plus 90 plus 68 plus 79) divided by 5 = 394 divided by 5 = 78.8. Deviations: 72 minus 78.8 = minus 6.8; 85 minus 78.8 = 6.2; 90 minus 78.8 = 11.2; 68 minus 78.8 = minus 10.8; 79 minus 78.8 = 0.2. Squared deviations: 46.24, 38.44, 125.44, 116.64, 0.04. Sum = 326.8. Sample variance = 326.8 divided by (5 minus 1) = 81.7. Sample standard deviation = square root of 81.7 = 9.04.
Interpreting Standard Deviation
A low standard deviation means data points are clustered close to the mean. A high standard deviation means they are spread widely. In a normal distribution, approximately 68 percent of values fall within one standard deviation of the mean, 95 percent within two, and 99.7 percent within three. This is known as the 68-95-99.7 rule, or the empirical rule. Standard deviation is the basis for many statistical tests, including z-scores, t-tests, and confidence intervals.
Reference Table: Sample standard deviation worked step by step
The data set is 12, 15, 11, 18, 14, 13. The mean is 13.83, the squared deviations total 30.83, and dividing by n minus 1 (5) gives a sample variance of 6.17 and a standard deviation of 2.48. Dividing by n instead would give the population figure of 2.27.
| Value | Deviation from mean | Squared deviation |
|---|---|---|
| 12 | -1.8 | 3.36 |
| 15 | +1.2 | 1.36 |
| 11 | -2.8 | 8.03 |
| 18 | +4.2 | 17.36 |
| 14 | +0.2 | 0.03 |
| 13 | -0.8 | 0.69 |
Worked Example on Screen
The capture below shows Standard Deviation Calculator after the inputs were entered, with the result on screen. Enter the same values to reproduce it.
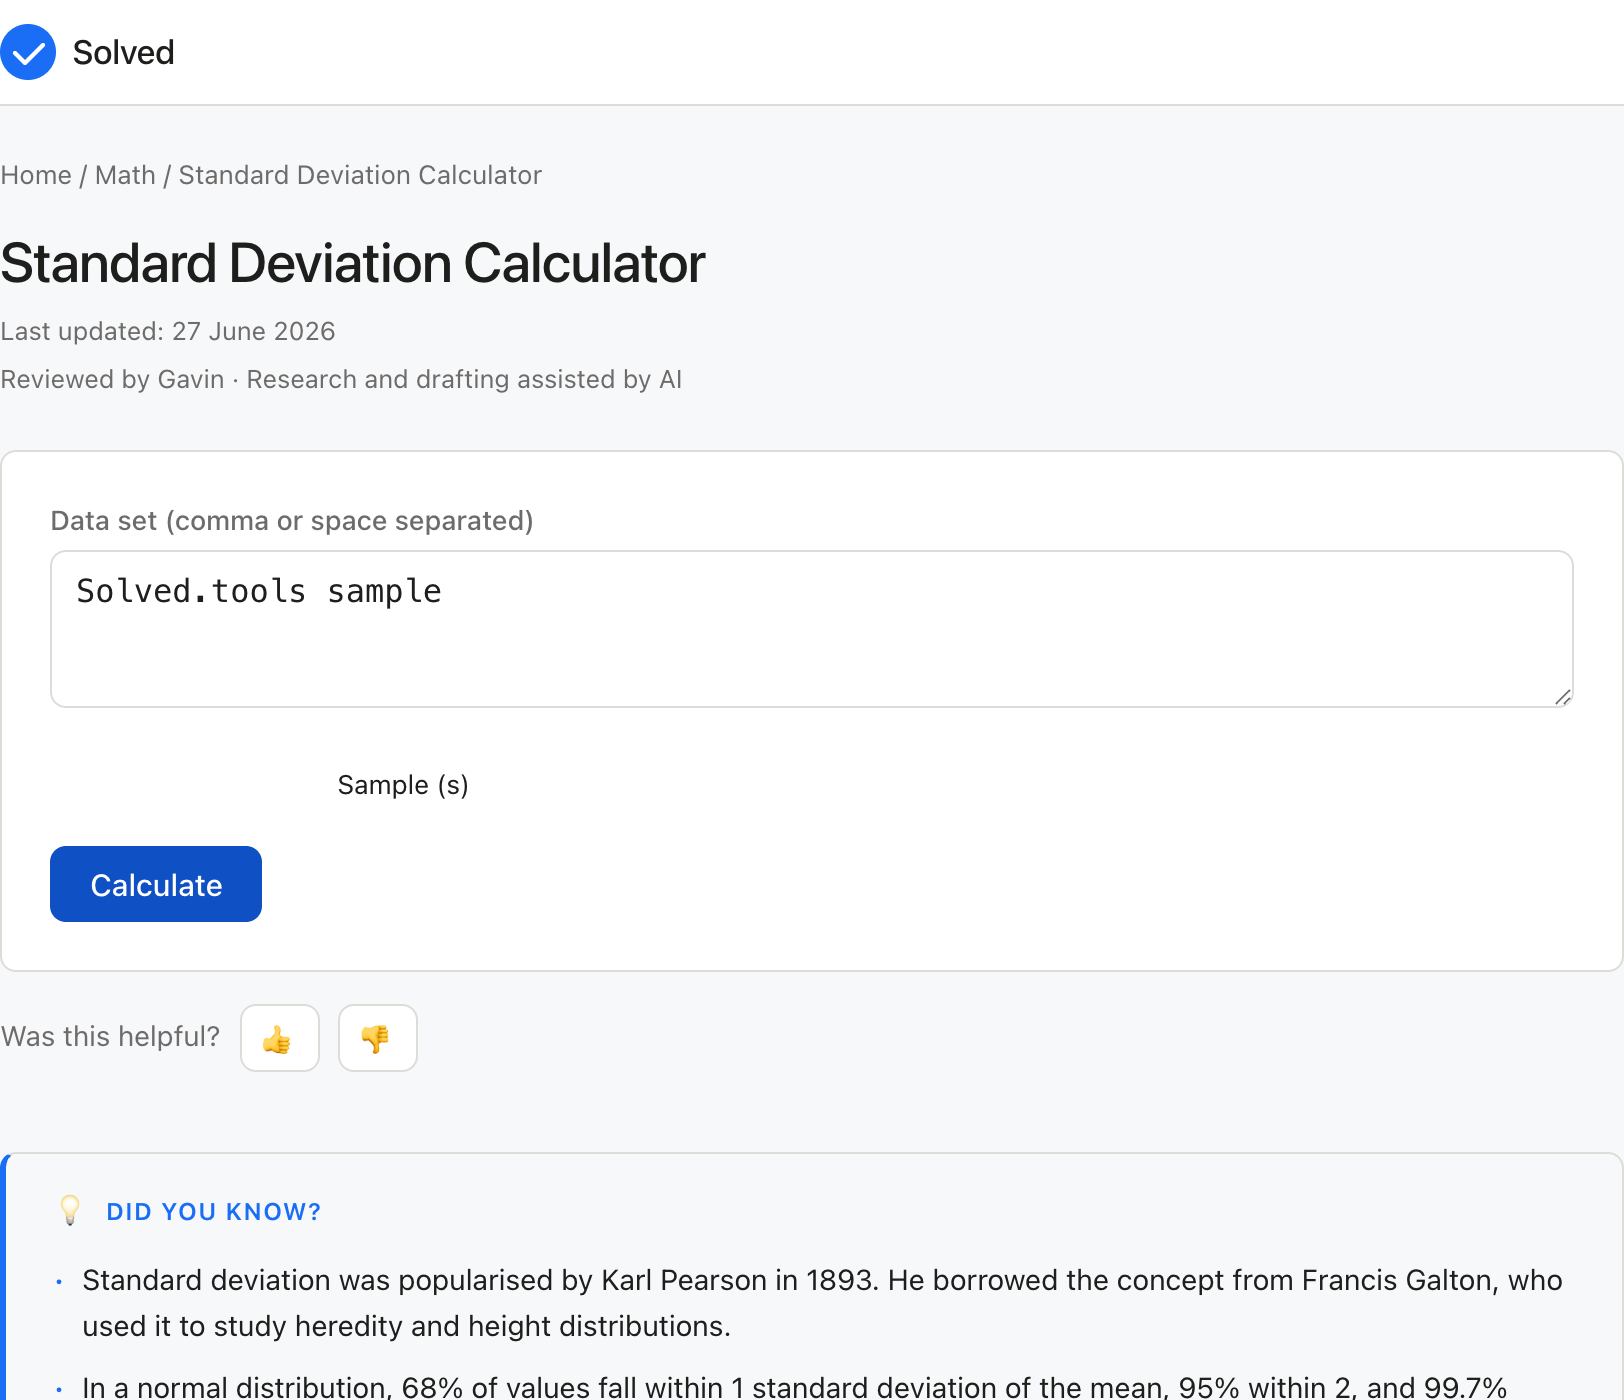
Captured from solved.tools on 10 September 2026.
Frequently Asked Questions
What is the difference between standard deviation and variance? Variance is the average of the squared deviations from the mean. Standard deviation is the square root of the variance and is expressed in the same units as the original data, making it more interpretable. Both measure spread, but standard deviation is more intuitive for most applications.
When should I use population vs sample standard deviation? Use population standard deviation (divide by n) when you have data for every individual in the complete group you care about. Use sample standard deviation (divide by n minus 1) when your data is a subset drawn from a larger population, which is the case in most practical research and quality control situations.
Why do we square the deviations? Squaring serves two purposes: it removes negative signs so deviations do not cancel each other out, and it gives extra weight to larger deviations. Taking the square root at the end returns the result to the original units of measurement.
What is a coefficient of variation and how is it different from standard deviation? The coefficient of variation (CV) is the standard deviation divided by the mean, expressed as a percentage. It allows comparison of variability across datasets with different units or different scales. A dataset with a mean of 100 and SD of 10 has a CV of 10 percent; a dataset with a mean of 1,000 and SD of 10 has a CV of just 1 percent, indicating much less relative variability.
Also try these free tools:
Inputs and Their Effects
Each field on the Standard Deviation Calculator form plays a distinct part in the calculation.
- your data values separated by commas or one per line in the input field - this value feeds the Standard Deviation Calculator directly and shows up in the result.
- whether your data represents a full population or a sample (choose sample if in doubt for most real-world datasets) - this value feeds the Standard Deviation Calculator directly and shows up in the result.
- Calculate to see the mean, variance, and standard deviation - this value feeds the Standard Deviation Calculator directly and shows up in the result. Editing one field of the Standard Deviation Calculator changes the output in line with the formula, so a misplaced value is visible in the answer.
Common Mistakes to Avoid
The errors that come up most often with the Standard Deviation Calculator are easy to spot once you know them:
- Entering a value in the wrong unit for your data values separated by commas or one per line in the input field; the Standard Deviation Calculator answer is only right when the unit matches the label.
- Mixing conventions, such as percentages and decimals, where the Standard Deviation Calculator formula expects one form.
- Rounding the inputs before the Standard Deviation Calculator runs; keep the full values and let the tool round the final answer.
- Treating the Standard Deviation Calculator result as exact when the inputs themselves were estimates.
When to Use This Tool
Use the Standard Deviation Calculator when you have the inputs to hand and want a single, reliable answer quickly. The Standard Deviation Calculator fits a well-defined question where the inputs are known and the output is a number you can act on. If the problem needs scenario modelling across many changing variables, a spreadsheet or a dedicated planning tool gives you more room than the Standard Deviation Calculator to compare outcomes side by side.
How the Math Works
The calculation behind the Standard Deviation Calculator follows the standard form for this kind of problem: For a sample standard deviation (s): compute the mean of the data values, subtract the mean from each value to find each deviation, square each deviation, sum all squared deviations, divide by (n minus 1) where n is the number of values, th The Standard Deviation Calculator applies that relationship in the order the algebra prescribes, converting inputs to consistent units first where the formula needs them.
Practical Tips
A few habits keep the Standard Deviation Calculator results reliable:
- Confirm each input matches the label, especially your data values separated by commas or one per line in the input field and whether your data represents a full population or a sample (choose sample if in doubt for most real-world datasets) if both are present.
- Work in one unit system throughout the Standard Deviation Calculator instead of converting mid-way by hand.
- Sanity-check the Standard Deviation Calculator output against a rough estimate before relying on it.
- Keep a note of the values you used so the Standard Deviation Calculator calculation can be reproduced later.
Troubleshooting Unexpected Results
When the Standard Deviation Calculator result does not match expectation, run through the usual suspects in order:
- Check the unit on your data values separated by commas or one per line in the input field first; a unit mismatch is the most common cause of a surprising Standard Deviation Calculator answer.
- Check the sign of each input; a negative where the Standard Deviation Calculator expects a positive flips the result.
- Check the magnitude; a Standard Deviation Calculator answer many orders of magnitude off is almost always a unit or decimal error.
- Re-run a simple round-number case by hand to confirm the Standard Deviation Calculator is wired up correctly.
Related Concepts and Where This Fits
The Standard Deviation Calculator fits alongside the other tools in its category, and the choice between them usually comes down to which inputs you already have. If the same numbers feed several tools, run them in one pass so the assumptions stay consistent across the comparison, which is where the Standard Deviation Calculator earns its place.