ROI Calculator
Last updated: 27 June 2026
Reviewed by Gavin Meiring, Lead research and primary author · Doctoral Candidate (Corporate Governance) · Research and drafting assisted by AI
- Warren Buffett's Berkshire Hathaway has achieved an average annual ROI of approximately 20% since 1965 — compared to ~10% for the S&P 500.
- ROI doesn't account for time. A 100% return over 10 years is far less impressive than a 100% return in one year, but both show as '100% ROI'.
- Marketing ROI is notoriously hard to measure. A 2019 Nielsen study found that companies overestimate the short-term ROI of TV advertising by up to 100%.
ROI Calculator
An ROI calculator measures the return on investment as a percentage, showing how much profit or loss you made relative to the amount you invested. It is used by investors, business owners, and marketers to compare the efficiency of different investments and to decide whether a project, campaign, or asset delivered value for money.
How to Use the ROI Calculator
- Enter the net profit from the investment (revenue minus costs), or enter the total return and initial investment separately.
- Enter the cost of the investment (the total amount put in).
- Click calculate to see the ROI percentage.
- Optionally enter the time period to see annualised ROI for comparing investments held for different lengths of time.
The Formula
The basic ROI formula is:
ROI (%) = ((Net Profit / Cost of Investment) x 100)
Or equivalently:
ROI (%) = ((Return - Cost) / Cost) x 100
Where Return is the total value received (including the original investment returned) and Cost is the initial outlay. For annualised ROI over multiple years:
Annualised ROI = ((1 + ROI as decimal)^(1/years) - 1) x 100
Real-World Example
You spend £5,000 on a marketing campaign. It generates £18,000 in revenue. The cost of goods sold is £8,000, so net profit from the campaign is £18,000 - £8,000 - £5,000 = £5,000.
ROI = (£5,000 / £5,000) x 100 = 100%
You doubled your investment. Now compare this to a simpler scenario: you buy shares for £10,000, they rise in value to £13,500, and you receive £500 in dividends over 2 years. Total return: £13,500 + £500 = £14,000. Net profit: £14,000 - £10,000 = £4,000.
ROI = (£4,000 / £10,000) x 100 = 40% over 2 years Annualised ROI = (1.40^(1/2) - 1) x 100 = approximately 18.3% per year
ROI Limitations to Be Aware Of
ROI is a simple and versatile metric, but it has limitations. It does not account for time value of money: a 50% ROI over 10 years is far less impressive than a 50% ROI over 1 year. It also ignores risk; two investments with identical ROIs may carry very different levels of uncertainty. For financial investments, other metrics such as IRR (Internal Rate of Return) and NPV (Net Present Value) account for timing of cash flows and are more precise. For business decisions, make sure all relevant costs are included in your calculation: staff time, overhead, opportunity cost, and any sunk costs that relate to the project. A high headline ROI that excludes hidden costs can lead to poor decisions.
Reference Table: Return on investment and annualised return
Four worked investments showing profit, total return and the annualised figure over five years. Total return divides profit by cost; the annualised column compounds that total over the holding period. A $25,000 investment returning $40,000 is a 60% total return and about 9.86% a year over five years.
| Cost | Value after 5 years | Profit | Total ROI | Annualised over 5 years |
|---|---|---|---|---|
| $1,000 | $1,200 | $200 | 20.0% | 3.71% |
| $5,000 | $6,500 | $1,500 | 30.0% | 5.39% |
| $25,000 | $40,000 | $15,000 | 60.0% | 9.86% |
| $100,000 | $85,000 | $-15,000 | -15.0% | -3.20% |
Worked Example on Screen
The capture below shows ROI Calculator after the inputs were entered, with the result on screen. Enter the same values to reproduce it.
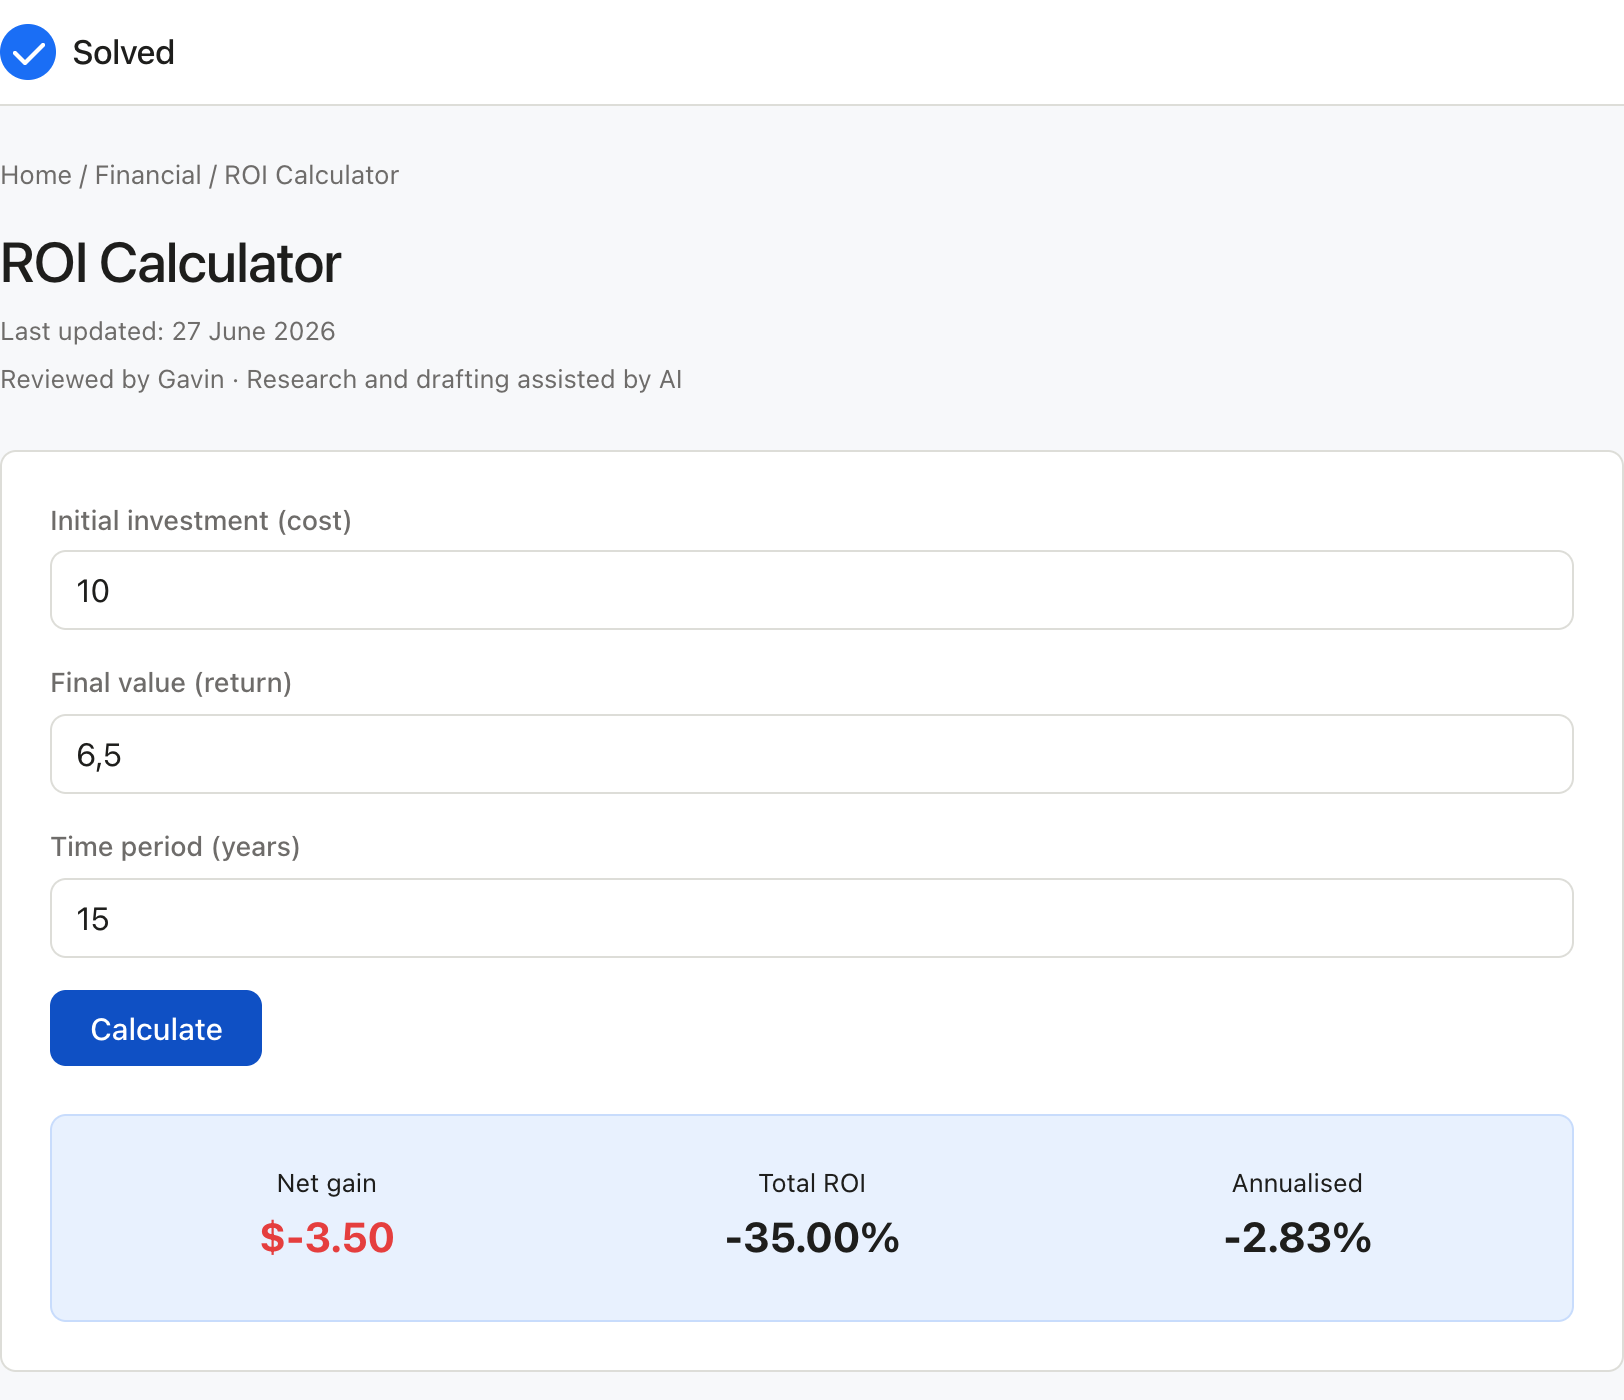
Captured from solved.tools on 10 September 2026.
The Same Return Over Different Periods
| Total return | Over 1 year | Over 2 years | Over 3 years | Over 5 years |
|---|---|---|---|---|
| 10% | 10.00% | 4.88% | 3.23% | 1.92% |
| 25% | 25.00% | 11.80% | 7.72% | 4.56% |
| 40% | 40.00% | 18.32% | 11.87% | 6.96% |
| 100% | 100.00% | 41.42% | 25.99% | 14.87% |
| 300% | 300.00% | 100.00% | 58.74% | 31.95% |
The columns are holding periods and the cells give the annualised return that produces the same total over that period. This is the reason a 40% gain over five years cannot be ranked against a 40% gain in one year: the first works out at 6.96% a year and the second at 40% a year. Convert both to the annualised figure before you compare them.
What Simple ROI Leaves Out
Simple ROI divides the net profit by the cost of the investment. The annualised figure compounds the total: take one plus the total return, raise it to the power of one over the number of years, and subtract one. A loss follows the same path and returns a negative annual rate, as the last row of the reference table above shows. Where the total return is negative, the annualised figure is worse than the total figure divided by the years would suggest, which is why a loss deserves the same conversion as a gain.
Three limits are worth stating plainly. Simple ROI ignores when the money came back, so two investments with the same total return rank equally even if one repaid in the first year and the other in the last. It ignores the size of the investment relative to everything else the business is doing. It says nothing about risk, so a 20% return from a savings account and a 20% return from a speculative position look identical on the page. For uneven cash flows, use the internal rate of return or the modified internal rate of return, both of which are available on this site. Subtract fees and tax before calculating, since neither is netted off here.
Frequently Asked Questions
What is a good ROI? There is no single answer, as a good ROI depends on the asset class, time horizon, and risk level. Equities have historically delivered around 7 to 10% annualised ROI before inflation. Real estate varies widely by location and gearing. Marketing ROI benchmarks vary by industry, but many businesses target at least a 5:1 return (400% ROI) on advertising spend. The key is comparing your ROI to the next-best alternative use of the same money.
How is ROI different from profit margin? Profit margin is profit as a percentage of revenue. ROI is profit as a percentage of the investment cost. A business can have a high profit margin but a low ROI if the assets required to generate that revenue are very large. ROI is more useful when comparing how efficiently capital is deployed, while margin is more useful for comparing pricing and cost structures.
Can ROI be negative? Yes. A negative ROI means you lost money on the investment: your return was less than your cost. For example, if you invest £10,000 and receive back £7,000, your ROI is -30%. Negative ROI does not always mean the decision was wrong; a loss-making marketing campaign that builds long-term brand awareness may have value that a simple ROI calculation does not capture.
How do I calculate ROI on rental property? Divide the annual net rental income (rent minus expenses such as mortgage interest, maintenance, insurance, and management fees) by the total cash invested (deposit plus purchase costs). A common variation is cash-on-cash return, which uses cash invested rather than property value, making it useful for comparing geared property investments.
Also try these free tools related to ROI Calculator: - Investment Calculator
Extended Reference Notes
The notes below cover the broader context that informs how to use the ROI Calculator well.
Typical Input Ranges
Most real-world uses of the ROI Calculator fall into a middle band where the result is stable and useful. Very small inputs to the ROI Calculator often round to zero or near-zero, and very large inputs amplify every rounding error in the calculation. The middle band, where the ROI Calculator inputs are ordinary sizes, is where the tool is most reliable.
Assumptions Behind the Formula
The ROI Calculator assumes the inputs stay fixed across the period or scenario being modelled. Rates move, values change, and fees appear, so treat the ROI Calculator output as a clean reference and layer in the frictions your own situation adds.
Common Edge Cases
Three situations change the ROI Calculator answer in ways the formula does not surface: boundary values near zero, rounding cascades across many steps, and unit mismatches between fields. When any of these apply, sanity-check the ROI Calculator result against an independent estimate.
When to Revisit the Calculation
The ROI Calculator output is only as current as its inputs, so re-run the calculation whenever a key value changes materially. A quarterly re-check of the ROI Calculator suits personal planning; monthly suits active business or investment decisions.
Relationship to Other Tools
The ROI Calculator shares inputs and outputs with the other tools in its category. If the same numbers feed several tools, capture them once and run each tool so the comparison stays consistent with the ROI Calculator.
Practical Checklist Before Relying on the Result
Before acting on the ROI Calculator output, run a short mental checklist: inputs in the right units, direction of the result matching intuition, and magnitude plausible. Each check takes seconds and catches the most common classes of ROI Calculator error before they reach a decision.
Putting the Result to Work
A single ROI Calculator run usually narrows the range of plausible answers rather than settling the question. Compare the ROI Calculator result against a benchmark or a previous run, and ask what would have to change for the answer to flip a decision.
Sensitivity to Inputs
Some inputs move the ROI Calculator result more than others; changing each by a small amount shows which ones matter. Spend the effort on the high-impact ROI Calculator inputs and treat the low-impact ones as approximate.
A Note on Stale Inputs
A calculation is only as fresh as the inputs that feed it, so note the date the ROI Calculator inputs were last refreshed. A six-month-old ROI Calculator result can be as wrong as a wrong calculation when the underlying values have moved on.