Mean / Median / Mode Calculator
Last updated: 27 June 2026
Reviewed by Gavin Meiring, Lead research and primary author · Doctoral Candidate (Corporate Governance) · Research and drafting assisted by AI
- The word 'average' traces back through Italian 'avaria' to the Arabic 'awariyah', meaning damaged goods — it originally described how merchants shared the loss of cargo damaged at sea.
- The term 'median' was introduced by the Victorian statistician Francis Galton in the 1880s.
- Karl Pearson coined the word 'mode' for the most frequent value in 1895, borrowing from the Latin 'modus', meaning 'manner' or 'fashion'.
Mean Median Mode Calculator
A mean, median, and mode calculator finds all three measures of central tendency for any data set you enter. It is widely used by students completing statistics assignments, teachers preparing lesson materials, and analysts who need a quick summary of where the centre of a data set lies.
How to Use the Mean Median Mode Calculator
- Enter your data values separated by commas or spaces into the input field.
- Click Calculate to generate all three measures simultaneously.
- Review the mean, median, and mode results along with the sorted data set.
- Read the step-by-step explanation for each measure to understand the working.
- Use the results to identify whether your data is symmetrical or skewed.
The Formula
Mean: sum all values and divide by the count. Mean = (x1 + x2 + ... + xn) / n
Median: sort the values in ascending order. If n is odd, the median is the middle value at position (n+1)/2. If n is even, the median is the average of the two middle values at positions n/2 and (n/2)+1.
Mode: the value (or values) that appear most frequently. A data set can have one mode (unimodal), two modes (bimodal), multiple modes (multimodal), or no mode if every value is unique.
Real-World Example
Data set: 5, 3, 8, 3, 9, 7, 3, 12, 6
Count: n = 9
Mean: (5+3+8+3+9+7+3+12+6) / 9 = 56 / 9 = 6.22
Sorted: 3, 3, 3, 5, 6, 7, 8, 9, 12
Median: middle value is at position 5 = 6
Mode: 3 (appears 3 times, more than any other value)
The mean is 6.22, the median is 6, and the mode is 3. The mean is slightly higher than the median, suggesting a mild positive skew caused by the value 12 pulling the average upward.
When to Use Each Measure
Each measure of central tendency is suited to different situations. The mean is the most commonly used and mathematically useful: it is sensitive to every value in the data set, making it ideal for symmetric distributions without extreme outliers. Exam scores, heights, and manufacturing measurements often suit the mean. The median is preferred when data is skewed or contains outliers. Household income, house prices, and response times often use the median because a few very large values would make the mean misleadingly high. The mode is used for categorical data (most popular shoe size, most common blood type) and for understanding the most typical value in a distribution. In a bimodal distribution, where two values are equally most common, the mode reveals a pattern the mean and median might miss.
Reference Table: Mean, median and mode on one data set
The data set is 3, 7, 7, 9, 12, 14, 14, 14, 20. The total is 100, so the mean is 11.11. The middle value of the sorted list is 12, and the mode is 14 with three appearances. The mean sits above the median because of the single high value of 20.
| Value | Deviation from mean |
|---|---|
| 3 | -8.11 |
| 7 | -4.11 |
| 7 | -4.11 |
| 9 | -2.11 |
| 12 | +0.89 |
| 14 | +2.89 |
| 14 | +2.89 |
| 14 | +2.89 |
| 20 | +8.89 |
Worked Example on Screen
The capture below shows Mean / Median / Mode Calculator after the inputs were entered, with the result on screen. Enter the same values to reproduce it.
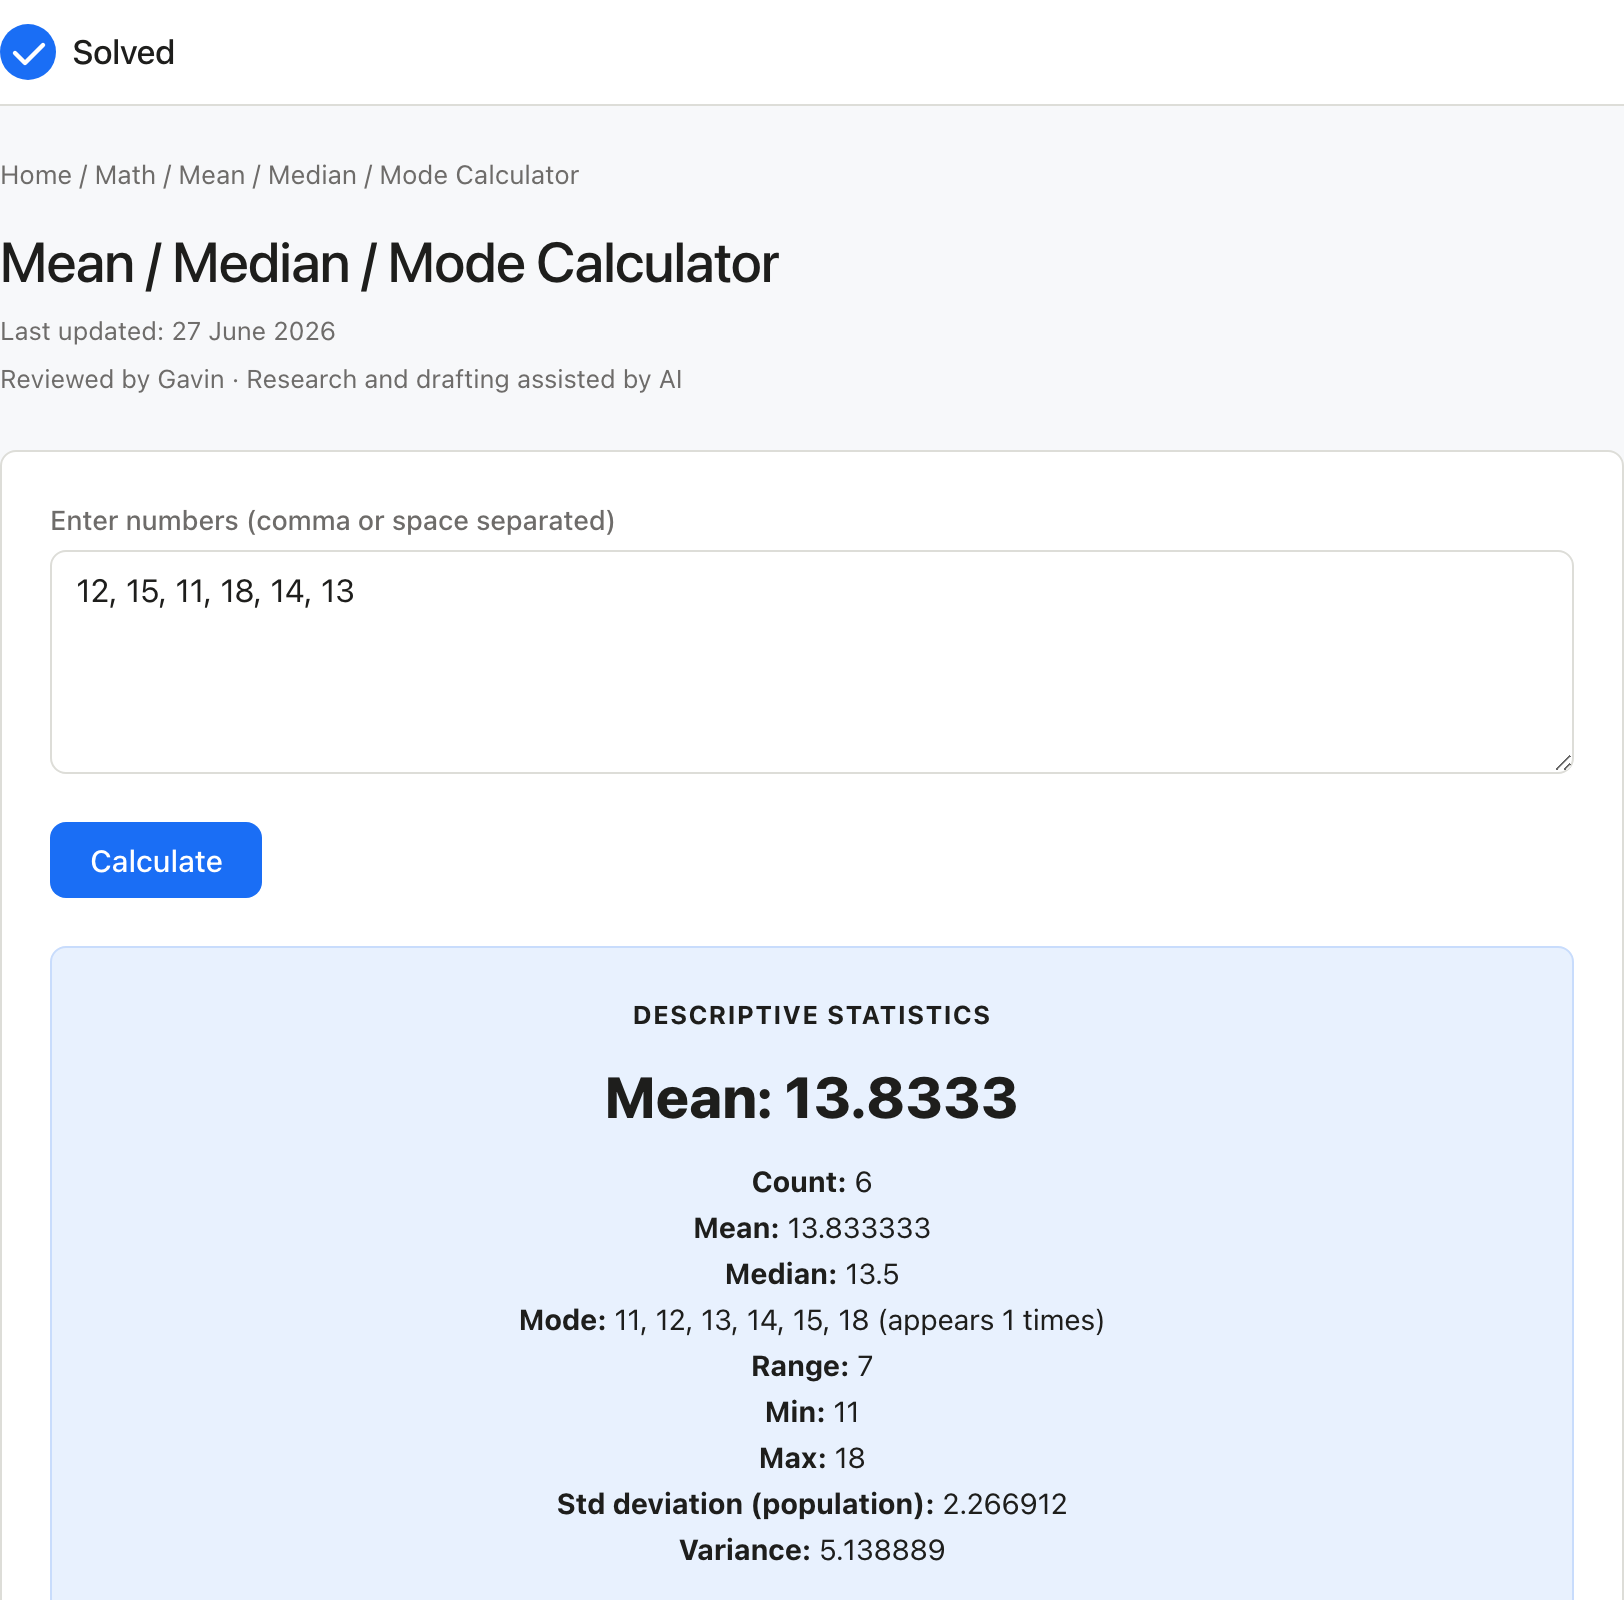
Captured from solved.tools on 10 September 2026.
Frequently Asked Questions
Can a data set have no mode? Yes. If every value in the data set appears exactly once, there is no mode because no value is more frequent than any other. Some calculators report "no mode" in this case, while others report every value. A data set with a single repeated value has one mode; with two repeated values of equal frequency, it is bimodal.
Why do the mean, median, and mode sometimes differ so much? In a perfectly symmetrical, bell-shaped distribution, the mean, median, and mode are all equal. When data is skewed, they diverge. In a right-skewed distribution (long tail to the right), the mean is pulled up by high values and sits above the median, which in turn sits above the mode. In a left-skewed distribution, the order reverses. The size of the gap indicates the degree of skewness.
Is the mean always between the smallest and largest values? Yes. The mean of a data set must always lie within the range defined by the minimum and maximum values. It cannot be less than the minimum or greater than the maximum. The median has the same property. The mode, however, can equal the minimum or maximum value if those values happen to be the most frequent.
Which measure should I report in a research paper? It depends on your data and audience. For normally distributed data, the mean and standard deviation are standard. For skewed data or ordinal scales, use the median and interquartile range. Always report the measure that best represents the typical value and pair it with an appropriate measure of spread. In practice, many research papers report both mean and median to give a fuller picture.
Understanding the Mean Median Mode
The Mean Median Mode is one of the most-requested tools in the mean median mode category because it condenses a calculation that would otherwise require manual work, a spreadsheet, or a specialist program into a single input-and-output step. whether you are a student, a professional, or a curious learner, the Mean Median Mode is designed to deliver a quick and trustworthy answer without forcing you to install anything or sign up for an account. Behind the scenes, the Mean Median Mode applies well-established mathematical or scientific formulas to the values you provide. the aim of Mean Median Mode is to remove the friction of hand calculation while still showing you the underlying method, so you can confidently interpret the result. Every calculation is performed locally in your browser, which means your inputs never leave your device.
When Should You Use the Mean Median Mode Calculator?
Use the Mean Median Mode Calculator whenever you need a quick, reliable answer that fits the tool's scope. Common situations for the Mean Median Mode Calculator include homework problems, workplace tasks, financial planning, fitness or health tracking, and everyday curiosity. If the Mean Median Mode Calculator answer will be used for a decision that has legal, medical, or financial consequences, treat the result as a starting point and verify it with a qualified professional. The Mean Median Mode Calculator is free to use, requires no sign-up, and works on any device with a modern browser. You can run the Mean Median Mode Calculator as many times as you like, change the inputs, and compare results side by side.
Common Inputs and How to Choose Them
Most Mean Median Mode Calculator problems revolve around a small set of inputs.
- your data values separated by commas or spaces into the input field is usually the first value to pin down for the Mean Median Mode Calculator.
- Calculate to generate all three measures simultaneously sets the context the Mean Median Mode Calculator needs for a sensible result.
- Review the mean, median, and mode results along with the sorted data set refines the Mean Median Mode Calculator output where the data is available. Identifying the right values is the most important step for the Mean Median Mode Calculator, because the answer is only as accurate as the data you put in. If a value is unknown, prefer a conservative estimate over a guess when using the Mean Median Mode Calculator.
How to Interpret the Result
The numerical answer from the Mean Median Mode Calculator alone is rarely the whole story. Read the units, the precision, and any warnings shown alongside the Mean Median Mode Calculator result. Understanding the path from inputs to output in the Mean Median Mode Calculator makes it easier to spot errors, communicate the result to others, and reuse the method for related problems in the future.
Worked Examples
A typical Mean Median Mode Calculator run takes reasonable inputs, produces a sensible answer, and returns it in a single click. Example: Data set: 5, 3, 8, 3, 9, 7, 3, 12, 6 Count: n = 9 Mean: (5+3+8+3+9+7+3+12+6) / 9 = 56 / 9 = 6.22 Sorted: 3, 3, 3, 5, 6, 7, 8, 9, 12 Median: middle value is at position 5 = 6 Mode: 3 (appears 3 times, more than any other value) The mean is 6.22, the median is 6, and the mode is 3. The mean is slightly higher than the median, suggesting a mild positive skew caused by the value 12 pulling the average
Common Mistakes to Avoid
Common mistakes with the Mean Median Mode Calculator:
- Mixing up units (for example, entering one unit when the Mean Median Mode Calculator expects another).
- Forgetting to convert percentages to decimals or vice versa where the Mean Median Mode Calculator formula requires it.
- Using a snapshot value that no longer reflects reality for the Mean Median Mode Calculator, especially for time-sensitive inputs like prices, rates, or counts.
- Rounding intermediate steps too early and then carrying the rounded value forward in the Mean Median Mode Calculator.
- Treating the Mean Median Mode Calculator as a substitute for professional advice when the decision is high-stakes.
Limitations and Assumptions
No calculator is a perfect model of reality, and the Mean Median Mode Calculator is no exception. The Mean Median Mode Calculator makes simplifying assumptions to keep the math tractable: it ignores rare cases, applies default values where inputs are missing, and uses formulas that suit the typical situation rather than the exotic one. When your situation falls outside the typical case, the Mean Median Mode Calculator result may drift further from the truth. If you need a more precise answer than the Mean Median Mode Calculator provides, the next step is usually a specialist, a more detailed reference, or a domain-specific tool.
Related Tools and References
For more depth on the Mean Median Mode Calculator topic, consult textbooks, academic papers, or reputable online resources. Reputable sources for the Mean Median Mode Calculator include government statistics agencies, university extension services, and peer-reviewed journals. Wikipedia is a useful starting point for definitions and formulas behind the Mean Median Mode Calculator, but always follow the citations to the original source before relying on a number. If you find that you need the same Mean Median Mode Calculator calculation repeatedly, consider writing down the inputs and the result in a note so you can build a personal record over time.
Quick Reference
- Free to use: yes, no sign-up required.
- Privacy: all calculations run locally in your browser.
- Units: metric and imperial supported where applicable; check the input labels.
- Speed: instant, no page reload.
- Mobile friendly: yes, works on phones and tablets.
- Offline: once the page has loaded, the calculation continues to work without a network connection.
References - General-purpose math references such as Wolfram MathWorld and Khan Academy for foundational formulas.
- Wikipedia articles on the relevant topic, with citations to primary sources, cover the Mean Median Mode Calculator background.
- Peer-reviewed journals and textbooks give the most rigorous treatments of the Mean Median Mode Calculator method.Tools/tools/calculator) - Percentage Calculator - Unit Converter
Also try these free tools: