Retirement Calculator
Last updated: 27 June 2026
Reviewed by Gavin Meiring, Lead research and primary author · Doctoral Candidate (Corporate Governance) · Research and drafting assisted by AI
- The 4% rule — withdraw 4% of your portfolio per year — was developed by financial planner William Bengen in 1994. Some researchers now suggest 3–3.5% is safer given current bond yields.
- 401(k) plans are named after a section of the US Internal Revenue Code. The first 401(k) was implemented in 1981. Before that, most Americans relied on company pensions.
- The average UK worker retires at 64 and lives to around 82. A $200,000 pension pot spread over 18 years — before State Pension — works out to just $11,000 per year.
Retirement Calculator
A retirement calculator estimates how much money you will have when you retire and whether it is enough to fund the lifestyle you want. It is used by anyone planning their pension, setting savings targets, or trying to understand how much they need to contribute now to retire comfortably later.
How to Use the Retirement Calculator
- Enter your current age and the age at which you plan to retire.
- Enter your current retirement savings balance.
- Enter your monthly or annual contribution to pensions and investments.
- Set the expected annual return on your investments.
- Enter your target annual income in retirement to see whether you are on track.
The Formula
The retirement calculator combines future value of current savings and future value of regular contributions:
Total at retirement = (Current savings x (1 + r)^years) + (Annual contribution x (((1 + r)^years - 1) / r))
Where r is the expected annual return as a decimal and years is the number of years until retirement. To check how long the pot will last, the drawdown calculation uses:
Years of income = ln(1 - (Balance x r / Annual withdrawal)) / ln(1 + r) x -1
Real-World Example
You are 35, plan to retire at 65, have £20,000 saved, contribute £400 per month, and expect a 6% annual return.
- Years to retirement: 30
- Future value of current savings: 20,000 x (1.06)^30 = approximately £114,870
- Future value of monthly contributions: 400 x (((1 + 0.005)^360 - 1) / 0.005) = approximately £401,810
- Total projected pot: approximately £516,680
If you withdraw £25,000 per year, this pot would last approximately 35 years, well into your 90s.
Why Starting Early Makes a Large Difference
Compound growth rewards time above almost everything else. Starting contributions at 25 instead of 35 on the same monthly amount at the same rate can roughly double the final pension pot. Delaying by even five years requires significantly higher monthly contributions to reach the same target. The State Pension provides a baseline (currently around £11,500 per year for a full qualifying record), but relying on it alone leaves most people with a significant income shortfall in retirement. A workplace pension with employer contributions is one of the most efficient ways to build a pot quickly, especially where the employer matches your contributions.
Reference Table: Balance at 65 from $500 a month
A $500 monthly contribution at 6% and 8% a year, started at three different ages and held to 65. Starting at 25 instead of 45 adds about $764,725 at 6%, without any extra contribution.
| Start age | 6% a year | 8% a year |
|---|---|---|
| Age 25 | $995,745 | $1,745,504 |
| Age 35 | $502,258 | $745,180 |
| Age 45 | $231,020 | $294,510 |
Worked Example on Screen
The capture below shows Retirement Calculator after the inputs were entered, with the result on screen. Enter the same values to reproduce it.
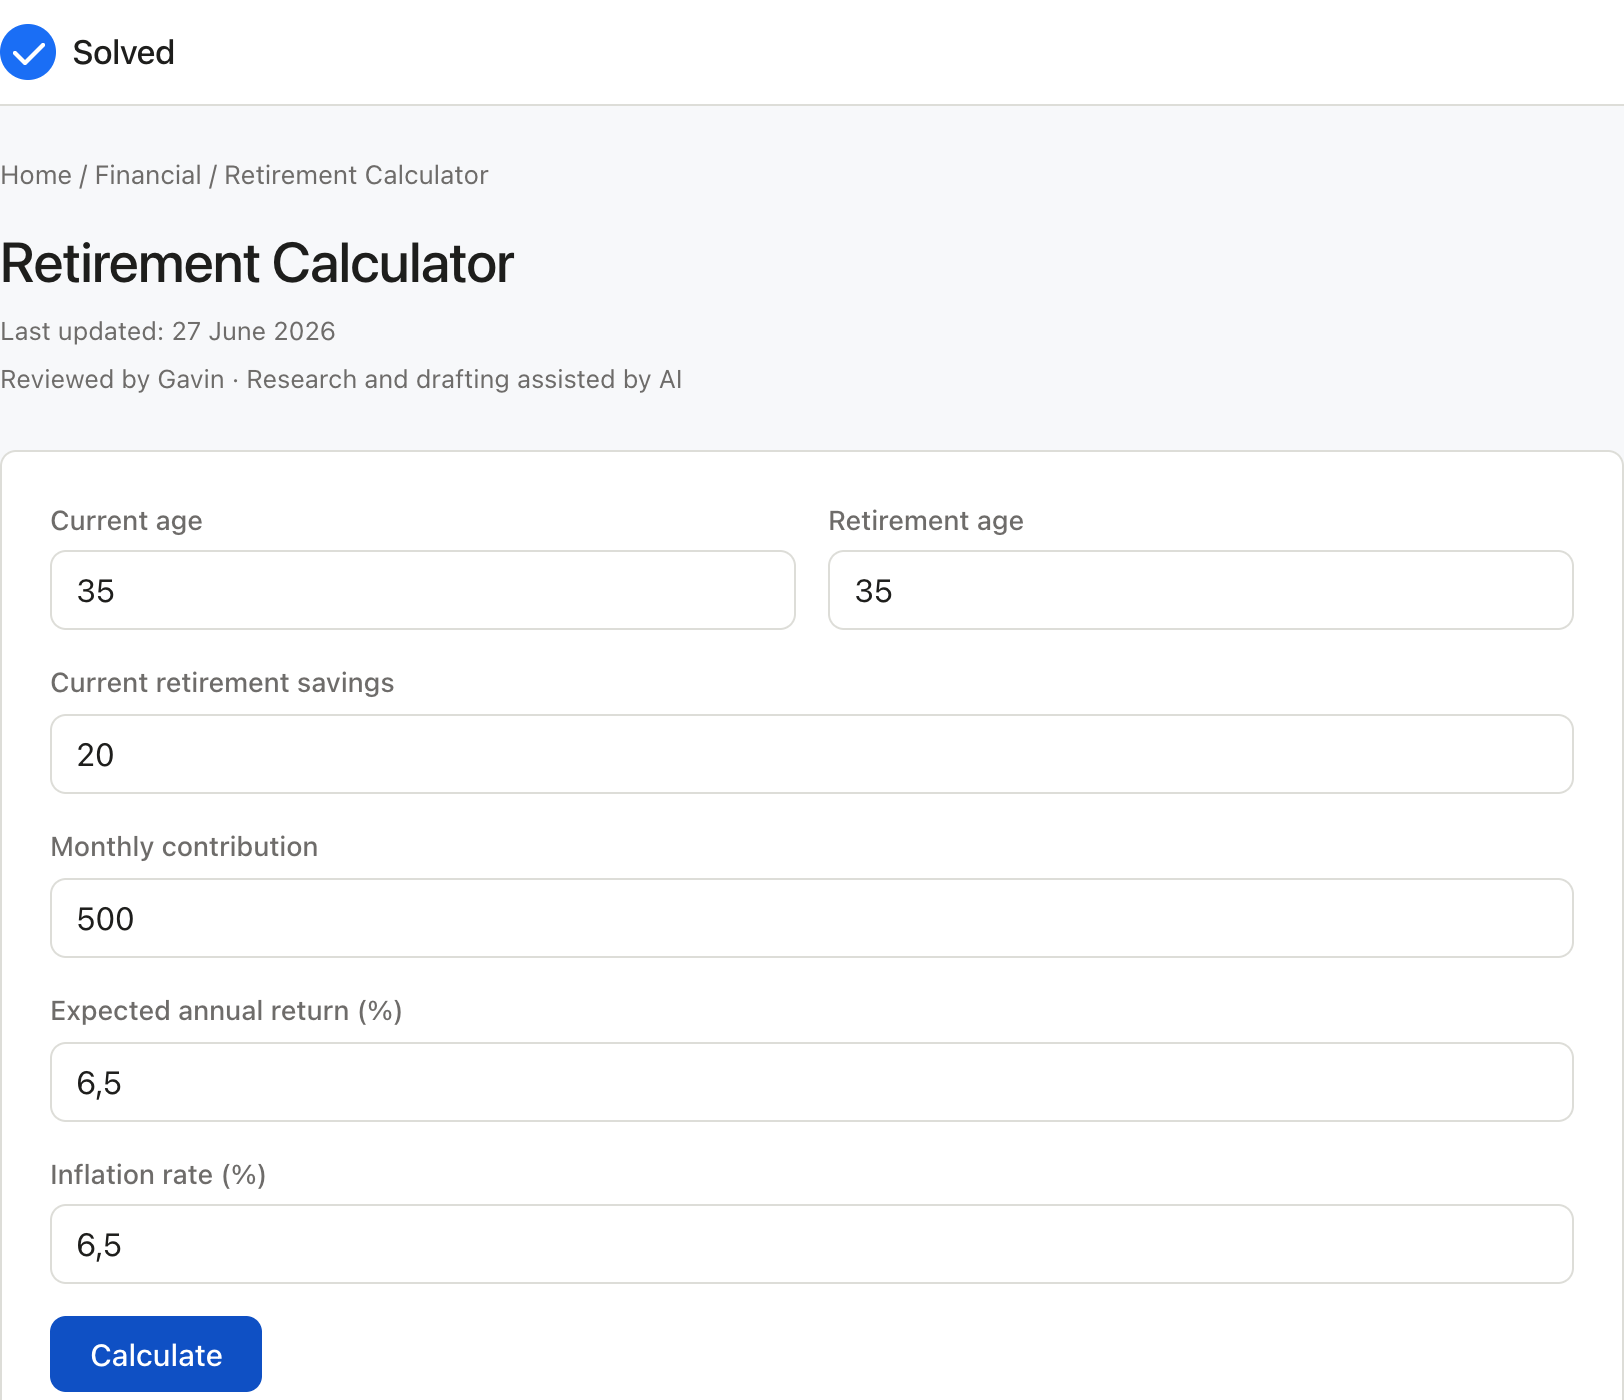
Captured from solved.tools on 10 September 2026.
Frequently Asked Questions
How much do I need to retire comfortably in the UK? The Pensions and Lifetime Savings Association suggests three benchmarks: minimum (£14,400 per year), moderate (£31,300 per year), and comfortable (£43,100 per year) for a single person. Couples need more. Use these figures as a starting point, then adjust for your own circumstances, housing costs, and planned lifestyle.
What rate of return should I use for my pension? UK pension illustrations typically show 2%, 5%, and 8% growth scenarios. Most financial planners recommend 5% as a central projection for a balanced fund after charges. If your pension is invested in bonds or cash, use a lower figure; for a higher equity allocation, you might use 6 to 7%, accepting more volatility.
Should I include the State Pension in my calculations? Yes. The full new State Pension (2024/25: approximately £11,500 per year) can form a meaningful part of your retirement income, but you need 35 qualifying years of National Insurance contributions to receive it in full. Check your State Pension forecast at gov.uk/check-state-pension to see how much you are on track to receive.
What happens if my investments underperform? Run the calculator at a lower return rate, such as 3%, to see a pessimistic scenario. If the result still covers your income needs, you have a comfortable margin. If not, increasing contributions, extending your retirement date, or adjusting your income target are the main levers available to close the gap.
How long a pot lasts at each withdrawal rate
The drawdown formula answers one question: given a balance, a return and a fixed annual withdrawal, how many years pass before the balance reaches zero. Small changes in the withdrawal move that answer a long way.
Take the £516,680 pot the worked example produces.
| Annual withdrawal | 0% return | 3% return | 5% return | 6% return |
|---|---|---|---|---|
| £25,000 | 20.7 years | 32.7 years | does not deplete | does not deplete |
| £30,000 | 17.2 years | 24.6 years | 40.5 years | does not deplete |
Two things in that table are worth pausing on. The first is the 0% column, which assumes the pot earns nothing at all. Even then, £25,000 a year lasts 20.7 years and £30,000 lasts 17.2 years, because a pot of half a million pounds is a large buffer. The second is what happens higher up: at a 5% return the £25,000 withdrawal stops emptying the pot, and the projection becomes a perpetuity rather than a term.
Why the growth rate and the withdrawal rate compete
A pot lasts forever when the withdrawal is smaller than the growth. £25,000 a year on £516,676 is 4.84%, and 4.84% sits below both the 5% and the 6% return rows above, so the balance rises in those columns instead of falling.
That is why the page's note that £25,000 a year would last about 35 years does not follow from a 6% return. At 6% the pot does not deplete at all: it grows. The return that makes £25,000 last exactly 35 years on this pot is 3.27%. Read the two figures together and the plan is clear: the withdrawal rate is 4.84%, and the return that would exhaust the pot over the horizon the page describes is 3.27%.
Put those two numbers side by side before trusting any retirement projection. When the withdrawal rate is below the assumed return, the arithmetic cannot fail and the real risks are charges, inflation and the order in which returns arrive. When the withdrawal rate is above the assumed return, the pot has an expiry date and the formula above will give it. A projection that pairs a high withdrawal with a high return is describing a plan with no room for a bad decade.
The price of the start age
The reference table above shows the end value from a 500-a-month contribution at three start ages, at two growth rates. Separating the contributions from the growth shows what the extra years actually buy.
| Start age and rate | Contributions paid | Growth earned | Growth as a share of the pot |
|---|---|---|---|
| 25 at 6% | £240,000 | £755,745 | 75.9% |
| 35 at 6% | £180,000 | £322,258 | 64.2% |
| 45 at 6% | £120,000 | £111,020 | 48.1% |
| 25 at 8% | £240,000 | £1,505,504 | 86.3% |
| 45 at 8% | £120,000 | £174,510 | 59.3% |
The saver who starts at 25 pays double the contributions of the saver who starts at 45, and ends with 4.3 times the pot at 6% and 5.9 times the pot at 8%. The extra £120,000 buys £644,725 of extra growth at 6%. Growth is 75.9% of the pot for the early starter at 6% and 86.3% at 8%, against 48.1% and 59.3% for the late starter. The start age is the one input in the whole calculation that cannot be changed later, which is the entire argument for the section below on starting early.
What the projection leaves out
Charges are the largest omission. The £400 a month at 6% above produces £516,676 with no charges, £465,124 if the fund takes 0.5% a year, and £419,342 if it takes 1%. Half a percentage point of annual charge costs £51,552 over 30 years on this plan, which is about eleven years of contributions at £4,800 a year. A projection run without a charge assumption overstates the pot by roughly a tenth.
Three more omissions sit behind that. The result is in nominal pounds, so it says nothing about what the money will buy at 65; running the same projection at a real return instead of a nominal one, which means subtracting the inflation assumption from the growth assumption, is the cleaner approach. The tax treatment of withdrawals is not in the model, and a large pot drawn down quickly crosses into higher-rate tax while the same pot drawn down slowly does not. And the cost of turning a pot into an income is not in the model either: an annuity quote and a drawdown plan are different products with different prices, and the projection stops at the balance rather than at the income.
Why UK projections use 2%, 5% and 8%
The page's observation that UK pension illustrations typically show 2%, 5% and 8% growth is a regulatory rule rather than a market convention. The FCA Handbook, in COBS 13 Annex 2, sets the standardised deterministic projection rates that a firm must use when it prepares a pension illustration: 2% at the lower rate, 5% at the intermediate rate and 8% at the higher rate for personal pension schemes and stakeholder pension schemes, with a parallel set of 1.5%, 4.5% and 7.5% for other products.
Those rates are a common basis for comparison between providers, not a forecast from any of them. The 6% used in the worked example above sits between the intermediate and the higher rate, and the 3% used in the FAQ answer on underperformance sits between the lower rate and the intermediate rate. When a provider shows you a projection, the useful question is which of the three rates it used and whether the charge is inside the figure.
Also try these free tools related to Retirement Calculator: - Investment Calculator